Powerful Tools for Smart Investors
Custom Stock Alerts provides a comprehensive suite of tools to help investors of all types stay on top of the market — from real-time alerts to free calculators with shareable links.
More tools are always being designed and suggestions are always welcome.
Real-Time Alerts
Get instant notifications via Email or SMS when your alerts trigger. Never miss an opportunity.
Mobile Friendly
Fully responsive design works perfectly on any device. Manage your alerts on the go.
Easy to Use
Intuitive interface with powerful capabilities. Set up alerts in seconds, not minutes.
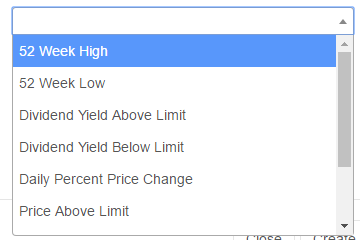
Stock Alert Types & Monitoring Options
- Price Above/Below X
- 52 Week High/Low
- Dividend Yield Above/Below X
- PE Ratio Above/Below X
- Daily Price Percent Change (Premium)
- Price Above/Below 50/200 Day Moving Average (Premium)
- Golden Cross / Death Cross (Premium)
- MACD Cross Above/Below Signal (Premium)
- RSI Above/Below Threshold (Premium)
Our Investment Tools & Stock Analysis Features
Stock Alerts
Create custom alerts based on price, dividend yield, PE ratio, and more. Get notified instantly when conditions are met.
Ex-Dividend Alerts
Never miss a dividend payment. Get alerted before ex-dividend dates and when companies increase their dividends.
Screeners
Filter stocks, ETFs, preferreds, dividend champions, and closed-end funds with our screening tools.
Stock Ideas NEW
Discover investment opportunities with curated stock ideas. Find 52-week highs, unusual volume, momentum stocks, and community insights.
ETF Overlap Calculator NEW
Compare two ETFs for holdings overlap by weight, shared positions, sector drift, and overweight names.
Portfolio Inspector NEW
Portfolio visualizer for funds and holdings: look-through exposure, sector charts, fund overlap, and income outlook. Free members save 1 portfolio; Premium saves up to 10.
Dividend Calculator NEW
Estimate annual, monthly, and quarterly dividend income from shares, yield, or ticker lookup. Presets, shareable links, and yield on cost.
Treasury Bill Calculator NEW
Discount yield and investment yield on T-bills from price or discount rate. Presets and shareable scenario links — no signup.
Compound Interest Calculator NEW
Model compound growth with contributions, compounding frequency, schedule table, and chart. Free; no ticker required.
Yield to Maturity Calculator NEW
Bond YTM, reverse pricing, YTC/YTW, duration, convexity, tax-equivalent yield, and six charts. Links to preferred and CEF screeners.
Stock Return Calculator
Compare investment performance across multiple stocks. Includes DRIP calculations and handles stock splits automatically.
Dividend Calendar
View all upcoming dividend payments in one place. Track dividend growth streaks and identify opportunities.
IPO Calendar Beta
View upcoming and recent initial public offerings. Calendar and table views with date range filters.
Earnings Calendar Beta
View earnings dates and estimates. Filter by ticker and date range with calendar and table views.
API Access
Integrate Custom Stock Alerts into your own applications. Full API access available for premium subscribers.
Stock Alerts
Create custom stock alerts in just a few simple steps. Get notified instantly when your conditions are met.
Use Cases for Stock Alerts
- Price Entry Points - Set alerts for when stocks drop to your target buy price. Perfect for value investors looking for entry opportunities.
- Exit Strategy - Get notified when stocks reach your profit targets or stop-loss levels. Essential for managing risk and locking in gains.
- 52-Week High/Low Tracking - Monitor when stocks hit new highs or lows to identify momentum shifts or oversold conditions. Get clear, descriptive messages like "AAPL has hit a new 52-week high of $200.00" or "MSFT is 5% off its 52-week low of $350.00".
- Valuation Alerts - Track PE ratios to find undervalued stocks or identify when valuations become stretched.
- Dividend Yield Monitoring - Set alerts for dividend yield thresholds to build or maintain income-focused portfolios. Messages include current yield values (e.g., "DIVO's dividend yield of 4.63% is above your target of 4.00%").
- Moving Average Crossovers - Premium feature alerts when stocks cross key moving averages (50/200-day), helping identify trend changes. Messages include both current price and moving average values for complete context.
- Golden Cross & Death Cross - Get alerted when the 50-day MA crosses above (Golden Cross) or below (Death Cross) the 200-day MA.
- MACD Crossovers - Alerts when the MACD line crosses above or below its signal line for momentum signals.
- RSI Thresholds - Set alerts for when RSI (14) goes above or below your chosen level (e.g. overbought above 70, oversold below 30).
Smart Alert Delivery
- Email Digests: Receive beautifully formatted HTML emails with all your alerts in one organized table, including direct links to view quotes and manage alerts.
- SMS Digests: Multiple alerts are grouped together in a single message. For longer digests, messages are intelligently split with pagination (e.g., "1/2", "2/2") so you never miss important information.
- Smart Formatting: All alerts include complete context - current values, target values, and clear descriptions of what triggered.
- We also highlight ex-dividend dates that fall on a Monday and remind you to buy by the prior Friday in both the Ex-Dividend table and in email/SMS alerts.
How It Works
Pick your ticker symbol

Pick your alert type
Enter your target value

Click Create - That's it!
Technical Indicator Alerts Premium
Get notified when stocks hit key technical signals - Golden Cross, Death Cross, MACD crossovers, and RSI levels - so you can act on momentum and trend changes without watching charts all day.
What Are Technical Indicator Alerts?
These alerts use classic chart indicators that many traders and long-term investors follow. We calculate 50-day and 200-day moving averages, RSI (Relative Strength Index), and MACD (Moving Average Convergence Divergence) from our price data and alert you the moment a condition is met.
Golden Cross & Death Cross
When the 50-day moving average crosses above the 200-day, it's called a Golden Cross, often seen as a bullish trend signal. When it crosses below, it's a Death Cross, often seen as bearish. Get one alert type for each so you can follow trend changes on your watchlist.
MACD Cross Above / Below Signal
MACD compares short- and long-term momentum. When the MACD line crosses above its signal line, it can signal building bullish momentum; when it crosses below, it can signal weakening momentum. We alert you on the day of the crossover.
RSI Above or Below Your Level
RSI (14) ranges from 0 to 100. Values above 70 are often considered overbought; below 30, oversold. You choose the threshold (e.g. 70 or 30), and we alert you when the stock's RSI crosses that level - great for mean reversion or confirmation.
Ex-Dividend Alerts
Never miss a dividend payment. The ex-dividend alert tool notifies you prior to a stock or ETF paying out its next dividend. Use this information to start or add to a position before the ex-dividend date.
Use Cases for Ex-Dividend Alerts
- Opportunistic Buying - Get alerted before ex-dividend dates to capture dividend payments. Perfect for timing entry points to maximize dividend income.
- Income Tracking - Monitor upcoming dividend payments across your portfolio. Essential for dividend investors managing cash flow and income planning.
- Dividend Growth Monitoring - Receive alerts when companies increase their dividends, helping you identify dividend growth stocks and track income growth over time.
- Portfolio Rebalancing - Use ex-dividend dates as natural rebalancing opportunities, especially when combined with our return calculator for strategic planning.
Key Features
- Alerts sent via your preferred notification method (Email or SMS)
- Includes percentage change information when dividends are increased
- Highly responsive table with fast loading times
- Sort by any field or filter with the search box
- Premium Feature: Automatically import dividend-paying companies from your stock alert list
Live Demo
Screeners
One family of tools to search and filter by your criteria. Stock Ideas helps you discover names; screeners let you narrow the universe.
Stock Screener
Find investment opportunities with our powerful stock screener. Use flexible double-handled sliders to fine-tune parameter ranges and discover stocks that match your criteria.
Stock Screener Filters & Search Options
- Market Cap - Filter by company size
- Dividend Yield - Find dividend-paying stocks
- PE Ratio - Screen by valuation metrics
- 52 Week Range - Identify stocks near highs or lows
- Related screeners
- More filters in the pipeline
Stock Screener Features & Export Options
- Highly responsive table with fast loading times
- Sort by any field or manually filter with the search box
- Hide or reset filters with one click
- Export your results:
- Excel format
- CSV format
- PDF format
Live Demo
Stock Ideas NEW
Discover investment opportunities with curated stock ideas. Find stocks hitting 52-week highs, unusual volume, momentum stocks, and see what the community is watching - all in one powerful tool.
Use Cases for Stock Ideas
- Momentum Investing - Find stocks hitting 52-week highs, showing strong momentum, or breaking out with increasing volume. Perfect for identifying trending stocks and breakout opportunities.
- Value Investing - Discover stocks near 52-week lows that may represent value opportunities. Combine with our stock screener for deeper analysis.
- Community Insights - See what other investors are watching with "Most Watched Stocks" and "Trending Now" to discover popular investment opportunities.
- Unusual Activity Detection - Identify stocks with unusual volume that may signal important news or events. Great for finding stocks before they make major moves.
- Quick Discovery - Browse curated lists instead of starting from scratch. Click any preset to instantly see stocks matching that theme.
- Alert Creation - Create stock alerts directly from any idea to get notified when conditions change.
Key Features
Market-Based Ideas
- 52-Week Highs - Stocks hitting new 52-week highs
- 52-Week Lows - Stocks near 52-week lows (value opportunities)
- Big Movers Today - Stocks with largest price changes today
- Unusual Volume - Stocks trading with significantly higher volume than average
- Momentum Stocks - Stocks trading above 50-day and 200-day moving averages
- Breakout Candidates - Stocks near 52-week highs with increasing volume
Community Insights
- Most Watched Stocks - Stocks with the most alerts created across all users
- Trending Now - Stocks with most alerts created in the last 30 days
- Community Favorites - Stocks tracked by the most unique users
- Most Viewed Today - Stocks with the most quote page views today
Stock Ideas Features & Export Options
- One-click preset exploration - Click any card to instantly see matching stocks
- Highly responsive table with fast loading times
- Sort by any field or manually filter with the search box
- Export your results:
- Excel format
- CSV format
- PDF format
- Create stock alerts directly from any idea
- View detailed quote information for any stock
Calendar Views
View key market events in one place with our calendar tools. Each calendar offers both a visual calendar view and a sortable table, so you can scan by date or drill into details.
IPO Calendar and Earnings Calendar are in beta and are offered as premium tools while we continue to build them out. Paid subscribers get access now - try them, share feedback, and help shape what we add next. We haven’t locked in every feature yet, but you can expect calendar and table views, date range filters, and more as we refine these tools.
What You Get in Calendar Views
- Visual calendar – See events by week or month; click a day to see what’s happening.
- Table view – Sortable, filterable tables with full detail (ticker, date, amounts, estimates, etc.).
- Date range – Choose custom from/to dates or use presets (e.g. next 30 days, past 30 days, next year).
- Export – Export table data to Excel, CSV, or PDF for your own analysis.
Available Calendars
Dividend Calendar
Upcoming ex-dividend and payment dates. Track dividend growth streaks and plan income.
View Dividend CalendarIPO Calendar Beta
Upcoming and recent initial public offerings. See dates, deal size, and key details.
View IPO CalendarEarnings Calendar Beta
Earnings announcement dates and estimates. Filter by symbol and date range.
View Earnings CalendarPaid members: Use the Tools menu to open any calendar. IPO and Earnings calendars are premium during beta; upgrade on Pricing if you’re on a free plan.
ETF Overlap Calculator NEW
See how much two ETFs overlap by portfolio weight, how many holdings they share, and where each fund is overweight versus the other.
What you get
- Overlap by weight - donut-style summary of shared exposure
- Holdings overlap % - share of each fund’s positions also in the other fund
- Overlapping holdings table - sorted by overlap contribution
- Overweight / underweight - top names where one ETF allocates more than the other
- Sector drift - when we have sector labels on underlying stocks
Portfolio Inspector
Our portfolio visualizer shows what you really own across multiple ETFs and individual holdings: look-through exposure to underlying stocks, sector concentration, fund redundancy, and a projected income calendar on a normalized portfolio.
Education only, not investment advice. Holdings for funds are sourced from SEC N-PORT where available. Pairwise overlap deep-dives for two ETFs remain on the ETF Overlap Calculator; Portfolio Inspector is the N-fund view of your whole basket.
Free members can analyze portfolios and save 1 portfolio (up to 10 holdings). Premium unlocks up to 10 saved portfolios and 200 holdings each.
What you get
- Look-through holdings - effective exposure to underlying names after fund weights
- Sector exposure - roll-up table and concentration warnings (e.g. heavy Technology weight)
- Fund overlap matrix - pairwise overlap by weight across every fund in your list; click a cell to open the full two-fund tool
- Income outlook - yield-weighted summary and upcoming ex-dividend dates on a normalized $100k illustration
- Saved portfolios - name, save, load, delete; optional taxable / IRA account type (1 free, up to 10 on Premium)
- CSV upload - import holdings with preview (ticker, weight, shares, cost basis columns)
- Holdings limits - Free: up to 10 holdings per portfolio; Premium: up to 200
Saved portfolios
Enter fund tickers with weights, or upload a CSV with ticker, weight, shares, and optional cost basis. Each saved portfolio has a nickname and optional account type (e.g. taxable vs Roth IRA) for future tax-aware views.
Dividend Calculator NEW
Estimate annual, monthly, and quarterly dividend income from shares, yield, or ticker lookup — with yield on cost and shareable scenario links.
What you get
- Three input modes — shares + yield, shares + dividend per share, or dollar amount invested
- Optional ticker lookup — pre-fill yield and price from live quote data
- Payment frequency — monthly, quarterly, semi-annual, annual, or weekly estimates
- Presets & shareable links — quick scenarios and copy-link sharing; URL bar syncs as you calculate
- Conversion path — ex-dividend alerts, dividend calendar, Portfolio Inspector, and DRIP via Stock Return Calculator
Treasury Bill Calculator NEW
Compute discount yield and investment (bond-equivalent) yield on U.S. Treasury bills from price or discount rate — with presets and shareable scenario links.
What you get
- Two input modes — price per $100 face value, or bank discount rate
- Discount & investment yield — standard T-bill yield conventions for comparison with bonds and CDs
- Presets & shareable links — common maturities and copy-link sharing; URL bar syncs as you calculate
- Conversion path — bond YTM calculator, dividend income tools, and Portfolio Inspector for cash vs income allocation
Yield to Maturity Calculator NEW
Full bond calculator: YTM from price, fair price from target yield, callable YTC/YTW, duration, convexity, DV01, tax-equivalent yield, and interactive charts.
What you get
- Three modes — yield from price, price from YTM, callable analysis
- Risk metrics — modified duration, convexity, rate sensitivity table
- Six charts — price–yield curve, cash flows, PV contribution, cumulative income, rate shocks, yield comparison
- Income funnel — links to preferred and CEF screeners for live market data
Compound Interest Calculator NEW
See how savings or investments grow with compound interest, optional monthly contributions, and your choice of compounding frequency.
What you get
- Future balance with breakdown of principal, contributions, and interest earned
- Year-by-year schedule and stacked growth chart
- Rule of 72 and effective APY for your compounding setting
- Presets for savings, long-term index mindset, and dividend-oriented illustrations
- Shareable links so you can bookmark or send the exact scenario
Uses a fixed annual rate for illustration. For real ticker history with dividends, splits, and DRIP, use the Stock Return Calculator below.
Try Compound Interest Calculator Stock Return CalculatorStock Return Calculator
Compare investment performance across multiple stocks with our comprehensive return calculator. Calculate returns with periodic investments, dividend reinvestment (DRIP), and automatic stock split adjustments. Includes advanced risk analysis and interactive visualizations.
Use Cases for Stock Return Calculator
- Deep Investment Analysis - Perform comprehensive analysis on different investment options to meet and maximize your investment results. Compare up to 10 stocks side-by-side with advanced risk metrics.
- Portfolio Strategy Comparison - Evaluate different investment strategies using preset ticker groups. Compare dividend growth ETFs, index funds, or sector-specific investments.
- Risk-Adjusted Performance - Analyze volatility, Sharpe ratio, and maximum drawdown to understand risk-adjusted returns, not just raw performance numbers.
- DRIP vs Cash Analysis - Compare scenarios with and without dividend reinvestment to see the power of compounding and make informed decisions about dividend strategies.
- Dollar-Cost Averaging Planning - Model regular investment contributions (monthly, quarterly, annually) to see how periodic investments affect long-term returns.
- Investment Decision Support - Use comprehensive return breakdowns, risk analysis, and interactive charts to make data-driven investment decisions.
Key Features
- Compare up to 10 tickers side-by-side
- Analyze up to 20 years of historical data
- Works with over 8,000 ticker symbols (stocks, ETFs, and more)
- Periodic Investment Calculator - Simulate regular contributions (monthly, quarterly, semi-annually, or annually)
- Dividend Reinvestment (DRIP) - Automatically reinvest dividends to see compound returns
- Handles stock splits automatically
- Normalized date ranges for fair comparisons
- Interactive Charts - Line and area charts with multiple export options
- Risk Analysis - Volatility, Sharpe ratio, Sortino ratio, Calmar ratio, and maximum drawdown
- Risk vs Return Scatter Plot - Visualize risk-adjusted performance
- Drawdown Analysis - See peak-to-trough declines over time
- Return Breakdown - Price appreciation vs dividend income analysis
- Quick Preset Strategies - Pre-configured ticker groups for popular investment strategies
- Export results (Excel, CSV, PDF, PNG)
Advanced Investment Analysis Capabilities
- Dollar-Cost Averaging - Model regular investment contributions over time
- Compare Scenarios - See results with and without dividend reinvestment side-by-side
- Risk Metrics Comparison - Compare volatility, Sharpe ratio, and other risk metrics across all investments
- Best/Worst Value Highlighting - Automatically highlights top and bottom performers in key metrics
- Index Comparison - Compare against market indices using their corresponding ETFs (SPY for S&P 500, QQQ for NASDAQ, etc.)
How to Use the Stock Return Calculator
- Select Stocks - Search and select up to 10 ticker symbols using our stock screener, or use quick preset investment strategy groups
- Set Investment Parameters - Enter initial investment amount and optionally enable periodic investments
- Choose Date Range - Select dates or use quick buttons (MTD, QTD, YTD, 1Y, 3Y, 5Y, 10Y, Max)
- Configure Dividend Options - Choose DRIP, cash collection, or calculate both scenarios
- Analyze Results - View detailed comparison table, interactive charts, risk analysis, and return breakdowns
Ready to Get Started?
Join nearly 5,000 investors using our tools today. Nearly 10,000 alerts are actively set up across the platform. Free accounts available with premium features for power users.
Sign Up Free View Pricing