Welcome back to another edition of upcoming dividend increases. This week’s analysis focuses on the most significant dividend increases for the week of January 26th, 2026. I’ll focus on dividend increases for the week of January 26th, 2026. I encourage investors to consider the power of dividend stocks, your pathway to steady and increasing income. There’s nothing like sitting back and collecting regular paychecks from everyday companies simply by holding their shares. Adopting a dividend growth strategy encourages your returns to grow, making your financial future brighter. Now is a great time to invest in dividend stocks and enjoy the financial rewards they bring.
Companies that regularly raise their dividends tend to be great long-term investments. Dividend increases suggest financial strength and stability, indicating that a company can generate reliable cash flow. It also requires management to deliberately plan capital allocation to make it a core tenet of the business. Consistent dividend growth typically indicates that a company is generating reliable cash flow, which in turn enables it to offer investors a combination of income and capital appreciation.
From the broader universe of investable stocks, I focus on those with a proven track record of annual dividend increases. I watch dividend increase announcements and combine those with other supporting data points. This information is core to my investment process, and I share it here to help you make more informed investment decisions.
This week, I’ll spotlight another group of companies and provide more detail on both the selections and the methodology behind them.
A few highlights from this week’s list:
- Average dividend increase: 5.1% (median: 4.55%)
- Average dividend streak: 15.6 years (median: 13.0 years)
My strategy focuses on buying, holding, and adding to positions in companies that raise their dividends annually and have the potential to outperform relevant benchmarks over time.
Why Dividend Increases Matter
When tracking upcoming dividend increases, dividend increases are a powerful signal of a company’s financial health and management’s confidence in future prospects. When a company raises its dividend, it demonstrates that it has sufficient cash flow to reward shareholders while still investing in growth opportunities. This balance between returning capital to shareholders and funding future expansion is a hallmark of well-managed companies.
Companies with a history of consistent dividend increases often outperform their peers over the long term. The discipline required to maintain and grow dividends typically leads to better capital allocation decisions and more sustainable business practices. Additionally, dividend growth can help protect investors against inflation, as increasing payouts can help maintain purchasing power over time.
How I Create the Lists
The information presented here is the result of combining multiple data sources: the U.S. Dividend Champions spreadsheet provides the universe of companies I review, and then upcoming dividend announcements. This combination joins data on companies with a track record of consistent dividend growth and the timeliness of their dividend increases. It’s important to note that every company on this list has a minimum of 5 years of dividend growth history.
To be considered for this list, a company must offer higher total annual dividends. Although a company might not increase its dividend every calendar year, its overall annual dividend can still grow.
What Is the Ex-Dividend Date?
The ex-dividend date is when you must own shares to qualify for an upcoming dividend or distribution. To be eligible, you must have bought the shares by the end of the preceding business day. For instance, if the ex-dividend date is Tuesday, you must have acquired the shares by the market close on Monday. If the ex-dividend date falls on a Monday (or a Tuesday following a holiday on Monday), you must have purchased the shares by the previous Friday.
Dividend Streak Categories
Here are the definitions of the streak categories that I’ll use throughout the piece.
- King: 50+ years.
- Champion/Aristocrat: 25+ years.
- Contender: 10-24 years.
- Challenger: 5+ years.
| Category | Count |
| King | 0 |
| Champion | 1 |
| Contender | 5 |
| Challenger | 0 |
This Week’s Upcoming Dividend Increases
The data is sorted by the ex-dividend date (ascending) and then by the streak (descending):
| Name | Ticker | Streak | Forward Yield | Ex-Div Date | Increase Percent | Streak Category |
| Royal Bank Of Canada | RY | 11 | 2.81 | 26-Jan-2026 | 6.85% | Contender |
| Fastenal Company | FAST | 26 | 2.15 | 29-Jan-2026 | 9.09% | Champion |
| Alliant Energy Corporation | LNT | 22 | 3.20 | 30-Jan-2026 | 5.42% | Contender |
| TXNM Energy, Inc. | TXNM | 15 | 2.83 | 30-Jan-2026 | 3.68% | Contender |
| Bank Of Montreal | BMO | 10 | 3.54 | 30-Jan-2026 | 2.82% | Contender |
| Lamb Weston Holdings, Inc. Common Stock | LW | 10 | 3.43 | 30-Jan-2026 | 2.70% | Contender |
Understanding the Data
Streak: Years of dividend growth history are sourced from the U.S. Dividend Champions spreadsheet.
Forward Yield: The payout rate is calculated by dividing the new payout rate by the current share price.
Ex-Dividend Date: This is the date by which you must own the stock to receive the dividend.
Increase Percent: The percent increase.
Streak Category: This is the company’s overall dividend history classification.
Show Me the Money
Here is a table that shows the new and old rates and the percentage increase. The table is sorted by ex-dividend day in ascending order and dividend streak in descending order.
| Ticker | Old Rate | New Rate | Increase |
| RY | 1.10 | 1.18 | 6.85% |
| FAST | 0.22 | 0.24 | 9.09% |
| LNT | 0.51 | 0.54 | 5.42% |
| TXNM | 0.41 | 0.42 | 3.68% |
| BMO | 1.17 | 1.20 | 2.82% |
| LW | 0.37 | 0.38 | 2.70% |
Additional Metrics
Here are additional metrics related to these companies. Some data points include yearly pricing action and the P/E ratio. The table is sorted the same way as the table above.
| Ticker | Price | 52W Low | 52W High | PE Ratio | % Off High |
| RY | 168.00 | 106.10 | 170.48 | 14.17 | 1% Off High |
| FAST | 44.61 | 35.31 | 50.63 | 33.28 | 12% Off High |
| LNT | 67.44 | 57.09 | 69.75 | 19.91 | 3% Off High |
| TXNM | 59.31 | 45.71 | 58.45 | — | New High |
| BMO | 135.77 | 85.40 | 132.96 | 13.54 | New High |
| LW | 44.33 | 47.87 | 83.98 | 33.20 | 47% Off High |
Tickers by Yield and Growth Rates
I’ve organized the table in descending order, allowing investors to prioritize the current yield. Additionally, the table includes some historical dividend growth rates. I’ve also incorporated the “Chowder Rule,” which combines the current yield with the five-year dividend growth rate.
| Ticker | Yield | 1 Yr DG | 3 Yr DG | 10 Yr DG |
| BMO | 3.54 | 3.1 | 3.2 | 6.0 |
| LW | 3.43 | 2.8 | 14.7 | n/a |
| LNT | 3.20 | 5.7 | 5.9 | 6.3 |
| TXNM | 2.83 | 5.2 | 5.5 | 7.4 |
| RY | 2.81 | 5.9 | 4.1 | 5.9 |
| FAST | 2.15 | 12.2 | 12.2 | 12.1 |
Investment Considerations
While all six companies in this week’s list demonstrate commitment to dividend growth, several stand out as particularly compelling investment opportunities for dividend-focused investors.
Fastenal Company (FAST) Fastenal’s impressive 9.09% dividend boost stands out as the week’s largest increase, reflecting exceptional operational momentum. This industrial distribution leader has maintained dividend growth for 26 consecutive years, earning Champion status in the dividend growth community. Fastenal’s business model centers on providing fasteners, tools, and supplies to manufacturing and construction customers through an extensive network of branches and vending machines. The company’s ability to consistently raise dividends through economic cycles demonstrates its pricing power and customer stickiness. With infrastructure spending on the rise and manufacturing activity remaining robust, Fastenal’s 2.15% yield offers income investors exposure to industrial growth while benefiting from a management team that prioritizes shareholder returns.
Royal Bank of Canada (RY) Royal Bank of Canada’s 6.85% dividend increase comes from one of North America’s most stable banking franchises. Operating in Canada’s highly regulated financial system, RY benefits from a concentrated banking market that limits competition and supports profitability. The bank’s 11-year dividend growth streak reflects its position as Canada’s largest bank by market capitalization, with operations spanning personal and commercial banking, wealth management, capital markets, and insurance. RY’s 2.81% yield provides U.S. investors with currency diversification and exposure to a banking system known for conservative lending practices. The bank’s consistent dividend growth, even during challenging periods, showcases the strength of the Canadian banking model and RY’s ability to generate reliable earnings.
Alliant Energy Corporation (LNT) Alliant Energy’s 5.42% dividend raise comes from a utility company that’s transforming its power generation mix while maintaining reliable service. With 22 years of consecutive dividend increases, LNT operates in the essential services sector, providing electricity and natural gas to customers in Wisconsin and Iowa. What makes Alliant interesting is its aggressive transition toward renewable energy—the company plans to eliminate all coal-fired generation by 2040. This utility’s 3.20% yield offers investors a defensive position in an industry with predictable cash flows, while the company’s renewable energy investments position it well for long-term regulatory support. Utility stocks like LNT typically appeal to income-focused investors seeking stability, and Alliant’s dividend growth track record demonstrates management’s commitment to returning capital to shareholders.
TXNM Energy, Inc. (TXNM) TXNM Energy delivered a 3.68% dividend increase, reflecting the company’s position in the energy sector where cash flow generation can be volatile but potentially rewarding. This 15-year dividend grower operates in an industry that’s seen significant transformation, with companies balancing traditional operations against the energy transition. TXNM’s 2.83% yield provides income investors with exposure to energy markets, which can offer diversification benefits when commodity prices are favorable. The company’s ability to maintain dividend growth through 15 years suggests management has successfully navigated various energy market cycles. For investors comfortable with sector-specific risk, TXNM offers a way to participate in energy sector income generation while benefiting from a management team that’s demonstrated commitment to dividend growth.
Bank of Montreal (BMO) Bank of Montreal’s 2.82% dividend increase comes with the highest yield among this week’s selections at 3.54%, making it particularly attractive for income-focused investors. BMO’s 10-year dividend growth streak reflects its status as one of Canada’s Big Six banks, operating in a market structure that has historically supported strong profitability. The bank’s operations span retail banking, commercial banking, wealth management, and capital markets, with a growing presence in the United States. BMO’s dividend yield stands out not just among this week’s companies, but also relative to most U.S. financial institutions, reflecting both the bank’s dividend policy and the Canadian banking sector’s traditional emphasis on shareholder returns. For yield-seeking investors, BMO offers an opportunity to capture attractive income from a well-established financial institution.
Lamb Weston Holdings, Inc. (LW) Lamb Weston’s 2.70% dividend increase comes from a company that’s carved out a dominant position in the frozen potato products market. With 10 years of dividend growth, LW operates in the consumer staples sector, providing food products that remain in demand regardless of economic conditions. The company’s business model focuses on processing potatoes into frozen products for restaurants, foodservice operators, and retail customers. Lamb Weston’s 3.43% yield offers investors exposure to defensive consumer spending while benefiting from a company that’s become a key supplier to major restaurant chains. The frozen food sector has shown resilience during economic downturns, and LW’s dividend growth track record suggests the company has maintained pricing power and operational efficiency. For investors seeking income from a consumer staples company with a specific market niche, Lamb Weston provides an interesting opportunity.
These companies offer investors the opportunity to participate in businesses that are actively growing their shareholder returns through dividend increases. While past performance doesn’t guarantee future results, these companies’ commitment to dividend growth, combined with their operational strengths, makes them worthy of consideration for dividend-focused portfolios.
For more detailed information about stock return calculations for these companies, you can use our Stock Return Calculator with SCHD (our benchmark), RY, FAST, LNT, TXNM, BMO, LW pre-loaded for a 10-year analysis.
Historical Returns
My investment strategy for identifying upcoming dividend increases focuses on identifying stocks that consistently outperform the market and grow their dividend payouts over time. For broad exposure to U.S. equity markets, excluding the REIT sector, I recommend the Schwab U.S. Dividend Equity ETF (SCHD).
SCHD features strong historical performance, offers a yield that exceeds that of the S&P 500, and consistently delivers increasing dividends. With over $70 billion in assets, it’s an incredibly popular dividend-growth ETF. The ten-year dividend growth rate is one of the four key factors that SCHD tracks in its index.
Based on this analysis and further due diligence, I have included several companies in my portfolio and will sometimes make timely purchases of existing holdings. The charts below assume dividends are reinvested.
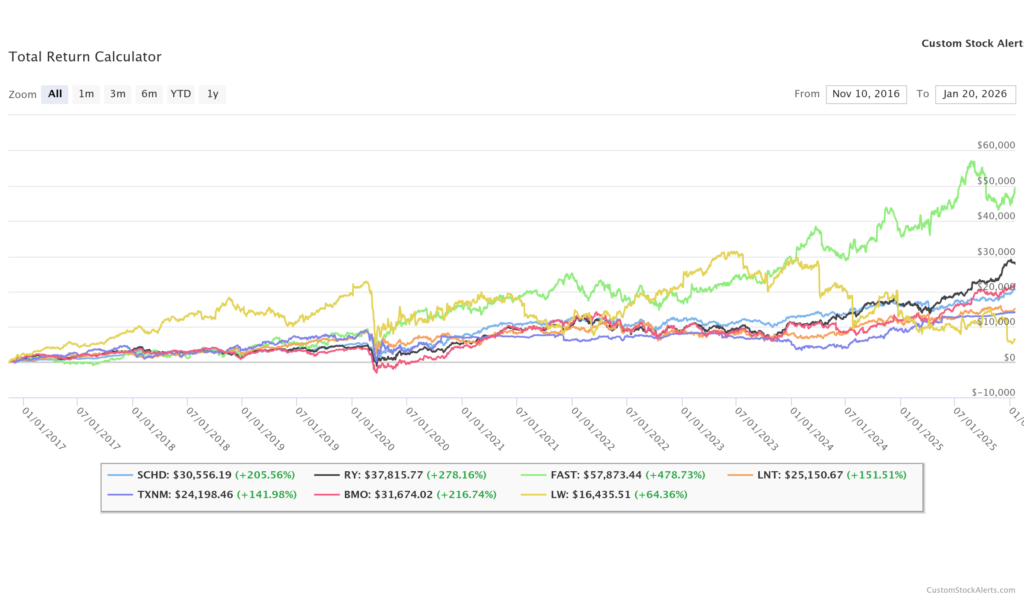
Right off the bat, I noticed the green line of Fastenal. They’ve had stellar performance for a long time, with a total return of nearly 478% since November 2016, good for a 21% CAGR!
SCHD, our benchmark, notched a total return of 205%, placing it firmly in the middle of the pack here. That CAGR comes to just about 13% annually. Again, it’s hard to complain about a set-it-and-forget-it performance like that.
Among the other tickers, RY and BMO—both large Canadian banks—beat SCHD by a fair margin, demonstrating strong long-term performance.
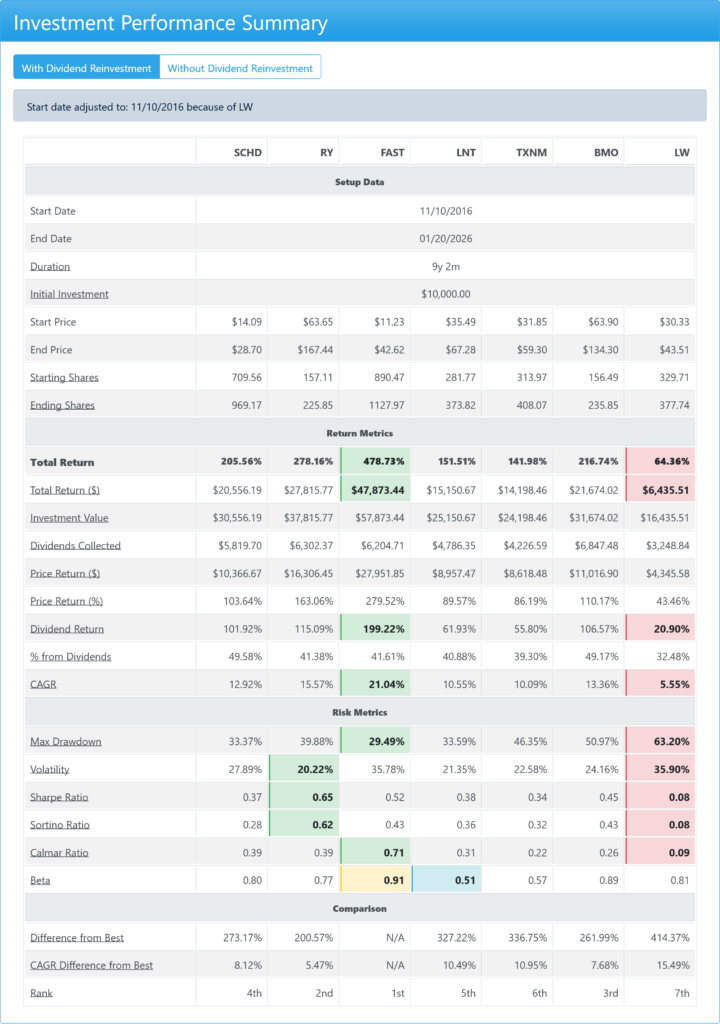
As I take a closer look at the robust data my stock return calculator offers, a few additional insights come to mind. Fastenal, while it had the best overall results, actually had the least “max drawdown”, quite impressive. Across the board, Lamb Weston had nearly the worst metrics, lowest total returns (and CAGR by definition), highest max drawdown, highest volatility, and lowest risk metrics (Sharpe, Sortino, and Calmar). As a reminder, here are those definitions.
RY (Royal Bank of Canada) fared quite well with the lowest volatility and the highest Sharpe and Sortino ratios.
I’d love to hear your thoughts on my strategy, so feel free to share yours in the comments below! As always, do your due diligence before making any investment decisions.


